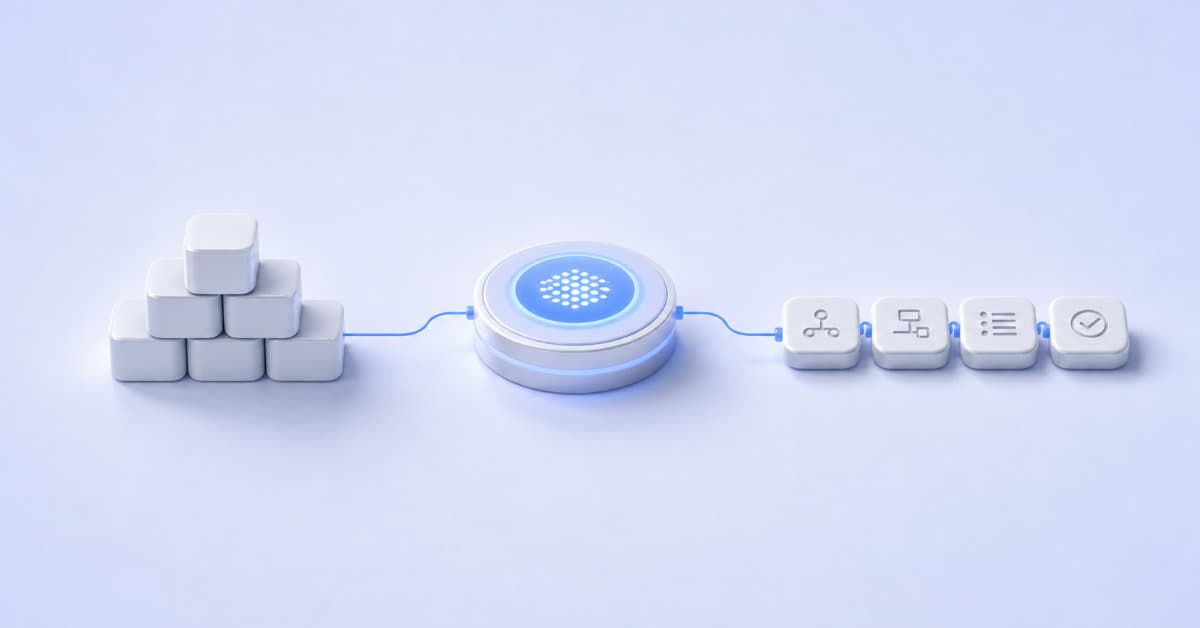


AI use is becoming something leaders can see, question and judge. AI tools work through text in small units called tokens, and counting them is becoming a practical way to discuss effort, cost and behaviour. A dashboard can record how many tokens were used, when, and for what work. The leadership question is whether those tokens are being used well.
That question puts pressure on teams. Heavy use can look wasteful when nobody can explain the work behind it. Light use can look passive when AI is expected to be part of the job. Teams are being asked to make AI useful while the structure for judging that use is still thin. The expectation is often magical, as if giving people AI access will make valuable work appear.
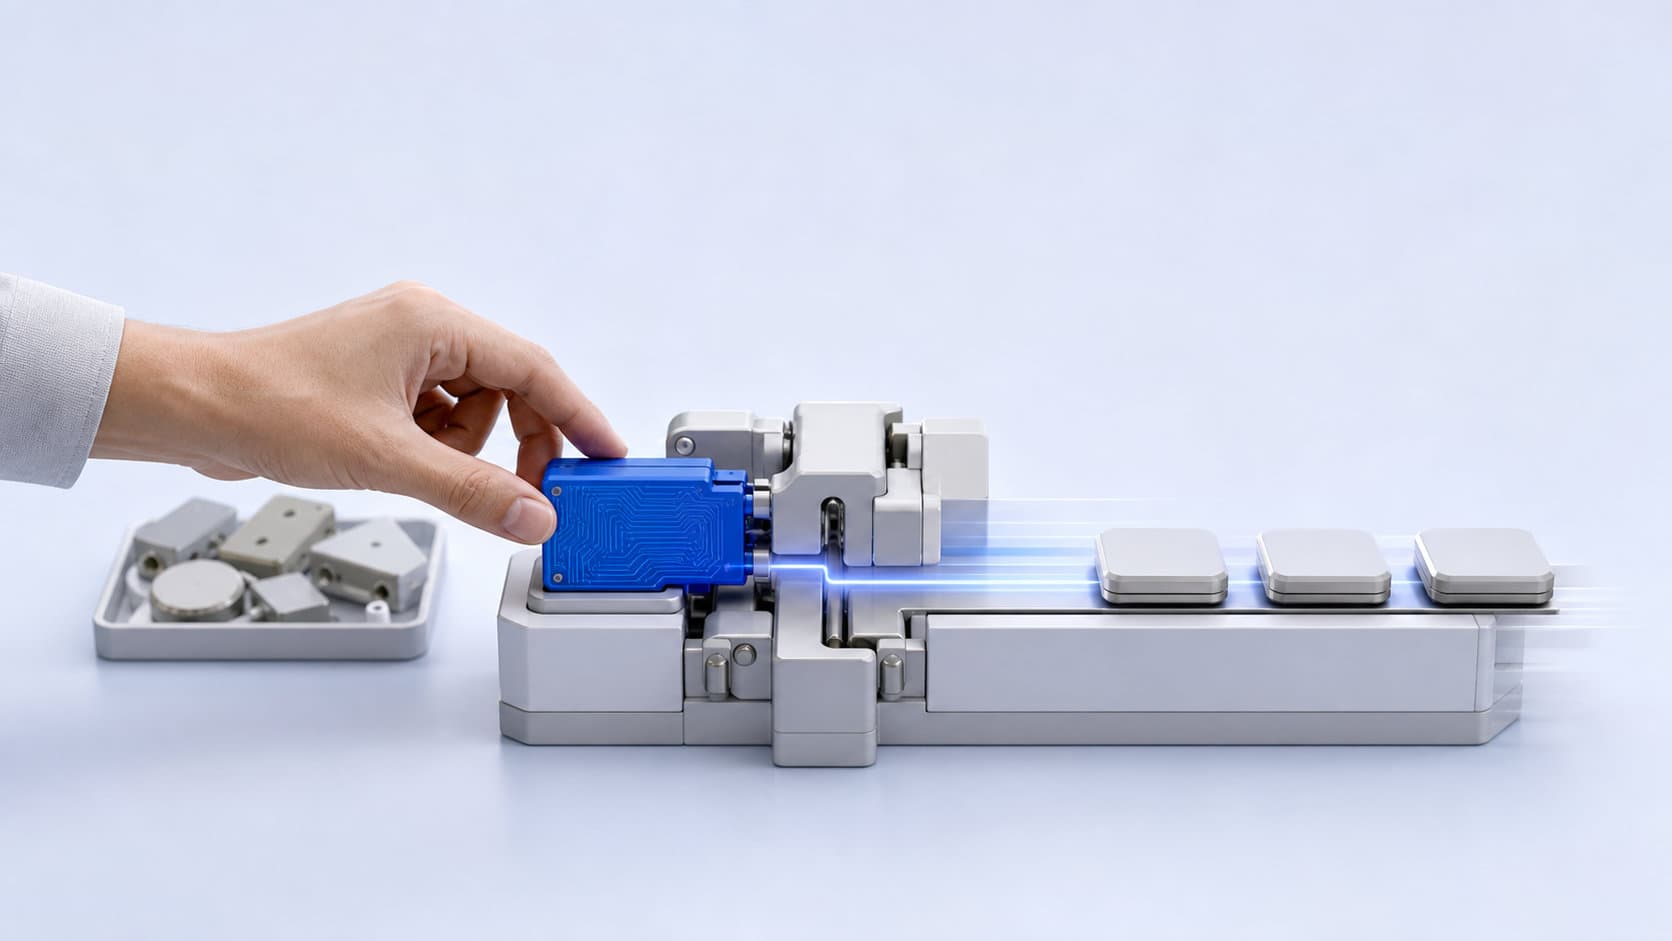
Factories faced the same problem when electric power first arrived. The power was valuable, but it did not automatically create a better factory, because work had to be organised around it. AI is at a similar stage, where people still need structure for using it well.
The dashboard is one such structure, because it lets a team discuss whether the usage made sense. That is more helpful than a vague feeling that someone is “using AI a lot” or “not using AI enough.”
Its visual model is the activity chart on GitHub, where software developers keep their code. It shows activity over time in a compact form. In a token chart, the days would show the rhythm of use and the kinds of work would show what sits behind it. The aim is to make AI activity easy to scan.
At team level, the record becomes shared. A manager can see where AI is being used across a group, and a team can see which work is attracting AI support and which is untouched.
The build can stay light. AI coding tools such as OpenAI’s Codex and Anthropic’s Claude Code can help create a simple dashboard once the usage data and the categories of work are clear. The leadership work is deciding what record to keep and making it simple enough that people will update it.